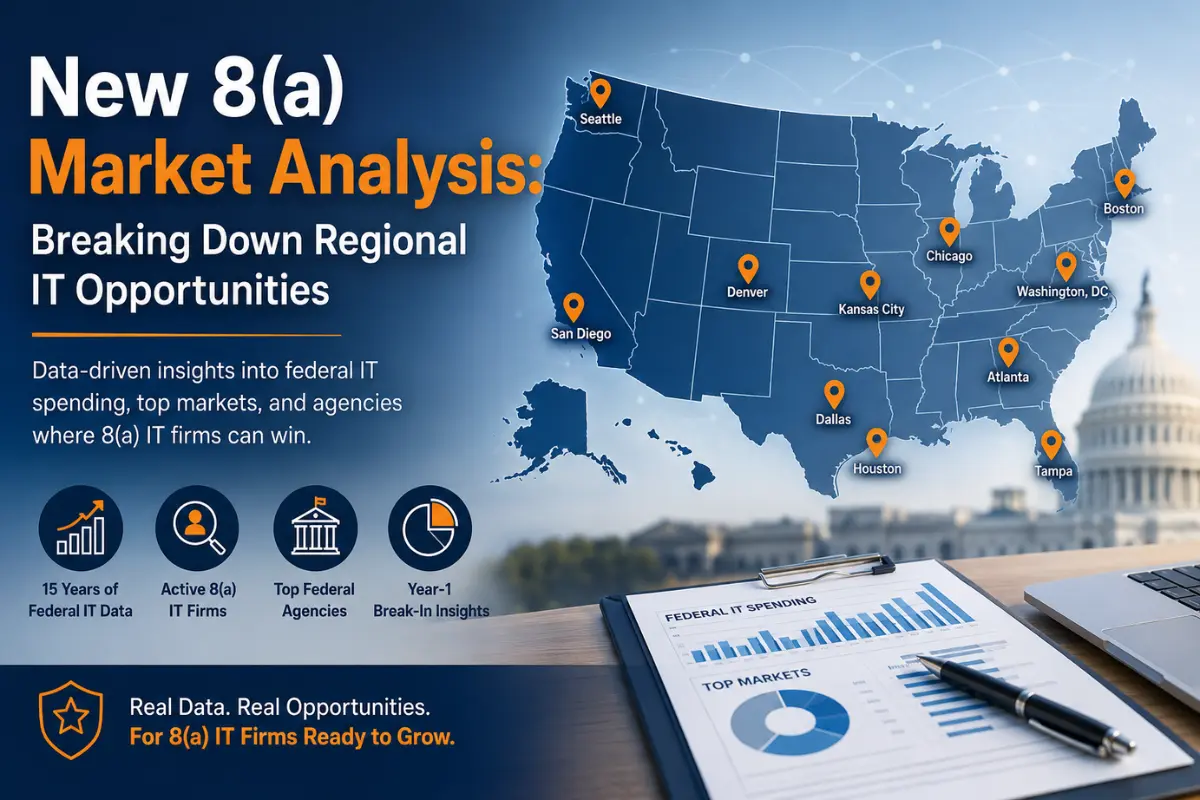
Many small IT firms refrain from pursuing the SBA 8(a) certification because they are not located in the Washington, D.C. Metro Area. They often struggle to identify localized federal opportunities or visualize what a successful first year looks like.
To bring clarity to your decision-making process, we analyzed federal IT spending across the country. This analysis spans from top-tier markets like Virginia to emerging regional markets like South Dakota.
Beyond baseline state rankings, this analysis highlights average sales for active 8(a) IT firms and identifies the optimal “break-in” agencies for Year 1. While other agencies may offer larger long-term contracts, these target buyers regularly award initial projects to emerging 8(a) firms that lack extensive federal past performance.
Methodology: How We Analyzed 8(a) IT Market Opportunities
Methodology: We analyzed 15 years of federal IT spending data across six primary IT NAICS codes from USA Spending, cross-referencing active 8(a) participant profiles in the Dynamic Small Business Search (DSBS) database.
Top 50 Regional 8(a) IT Market Opportunities
| Rank | ST | Best Market | Anchor Agencies / Buyers | Active GSA IT SB Firms | Avg Sales / Active GSA IT Firm | Est. Yr-1 Break-In Base |
| 1 | VA | Northern Virginia | DHS; DoD; GSA; VA; Army; primes | 665 | $5,950,012 | $1,535,050 |
| 2 | MD | Baltimore / Bethesda / Fort Meade | CMS; NIH; DISA; Fort Meade ecosystem | 281 | $4,869,284 | $2,698,885 |
| 3 | TX | San Antonio | Air Force; Army; cyber; DHA | 47 | $2,094,419 | $647,666 |
| 4 | GA | Warner Robins / Atlanta | Air Force / Robins AFB; CDC | 36 | $6,487,520 | $1,252,398 |
| 5 | FL | Tampa | SOCOM; CENTCOM; MacDill AFB | 94 | $2,365,876 | $763,401 |
| 6 | CA | San Diego | Navy / NAVWAR; Marine Corps; DHS | 58 | $2,981,126 | $961,925 |
| 7 | CO | Colorado Springs | Space Force; Air Force; NORAD/NORTHCOM | 25 | $3,782,931 | $1,169,811 |
| 8 | AL | Huntsville | Army / Redstone Arsenal; MDA; NASA Marshall | 21 | $3,926,271 | $1,128,747 |
| 9 | OH | Dayton | Air Force / Wright-Patterson / AFMC | 32 | $1,854,054 | $603,006 |
| 10 | MA | Boston / Hanscom | Air Force / Hanscom AFB; HHS research | 20 | $1,971,265 | $609,582 |
| 11 | HI | Honolulu | INDOPACOM; Navy; Army; Air Force | 7 | $3,418,077 | $1,102,917 |
| 12 | SC | Charleston | Navy / NIWC Atlantic; Joint Base Charleston | 5 | $3,061,012 | $987,702 |
| 13 | MO | St. Louis | NGA; Air Force / Scott AFB metro | 5 | $2,898,451 | $935,248 |
| 14 | NE | Omaha | USSTRATCOM; Offutt AFB | 2 | $6,670,404 | $1,306,820 |
| 15 | NM | Albuquerque | Air Force; DOE/NNSA; Sandia ecosystem | 4 | $3,283,550 | $1,015,385 |
| 16 | NC | Fayetteville / Research Triangle | Army / Fort Liberty; EPA/research | 19 | $3,795,598 | $1,091,180 |
| 17 | PA | Philadelphia | DLA; Navy; VA | 22 | $2,104,020 | $678,907 |
| 18 | WV | Clarksburg / Morgantown | FBI; Treasury / Fiscal Service; DOE | 10 | $4,025,573 | $1,123,819 |
| 19 | OK | Oklahoma City | Air Force / Tinker AFB | 7 | $5,574,406 | $1,252,398 |
| 20 | UT | Hill AFB / Salt Lake City | Air Force / Hill AFB | 9 | $1,685,437 | $603,006 |
| 21 | WA | Seattle / Bremerton | Navy; Army / JBLM; GSA | 7 | $1,887,774 | $629,210 |
| 22 | NY | Rome / New York City | AFRL Rome; GSA/civilian agencies | 34 | $3,003,267 | $928,712 |
| 23 | NH | Portsmouth | Navy / Portsmouth Naval Shipyard | 6 | $10,466,089 | $1,306,820 |
| 24 | AK | Anchorage / Fairbanks | Army Alaska; Air Force; DOI | 15 | $3,967,102 | $1,280,072 |
| 25 | NJ | Picatinny / Fort Dix corridor | Army / Picatinny; Joint Base MDL | 29 | $1,809,733 | $560,597 |
| 26 | IL | Chicago / Great Lakes | GSA; VA; Navy / Great Lakes | 17 | $2,558,011 | $320,066 |
| 27 | IN | Indianapolis | DFAS; VA; Army / Crane nearby | 12 | $3,345,451 | $1,079,482 |
| 28 | NV | Las Vegas | Air Force / Nellis; DOE/NNSA | 8 | $4,690,329 | $1,306,820 |
| 29 | AZ | Tucson / Phoenix | Air Force; Army; DHS/CBP | 14 | $2,487,122 | $802,524 |
| 30 | VT | Burlington | USCIS; National Guard | 3 | $11,251,542 | $1,535,050 |
| 31 | KS | Kansas City | USDA; GSA; Army / Fort Riley | 11 | $2,553,085 | $419,092 |
| 32 | MI | Detroit / Warren | Army / Detroit Arsenal; VA | 10 | $2,760,859 | $793,707 |
| 33 | TN | Oak Ridge / Nashville | DOE / Oak Ridge; TVA; VA | 8 | $3,073,367 | $157,173 |
| 34 | KY | Fort Knox / Louisville | Army / Fort Knox; VA | 2 | $2,475,123 | $711,562 |
| 35 | CT | New London / Groton | Navy / submarine ecosystem | 7 | $209,789 | $629,210 |
| 36 | LA | New Orleans / Bossier City | Navy; Coast Guard; Air Force | 3 | $430,759 | $629,210 |
| 37 | ME | Kittery / Portland | Navy / Portsmouth Naval Shipyard | 2 | $144,852 | $629,210 |
| 38 | MS | Stennis / Gulfport | NASA Stennis; Navy; Coast Guard | 1 | $88,843 | $629,210 |
| 39 | RI | Newport | Navy / NUWC Newport | 0 | $0 | $726,011 |
| 40 | WY | Cheyenne | Air Force / F.E. Warren | 2 | $5,911,075 | $1,252,398 |
| 41 | DE | Dover | Dover AFB; VA | 4 | $2,632,242 | $849,350 |
| 42 | MN | Minneapolis / St. Paul | VA; USDA; regional offices | 6 | $1,646,262 | $180,077 |
| 43 | OR | Portland | Bonneville Power / DOE; USACE; Forest Service | 7 | $1,355,533 | $99,724 |
| 44 | WI | Milwaukee | VA; USDA; regional offices | 4 | $588,463 | $180,077 |
| 45 | IA | Des Moines | USDA; VA | 3 | $635,703 | $320,095 |
| 46 | ID | Idaho Falls / Boise | DOE / Idaho National Laboratory; BLM | 2 | $538,717 | $99,724 |
| 47 | MT | Great Falls / Helena | Air Force / Malmstrom; DOI/USDA | 1 | $126,754 | $629,210 |
| 48 | AR | Little Rock | Little Rock AFB; VA; USDA | 1 | $117,500 | $629,210 |
| 49 | ND | Minot / Grand Forks | Air Force | 0 | $0 | $695,777 |
| 50 | SD | Rapid City | Air Force / Ellsworth | 0 | $0 | $695,777 |
Also read our article: 8(a) Certification: Still the King of Federal Contracting?
What These 8(a) IT Market Opportunities Mean for Your Business
Data shows that 8(a) IT opportunities aren’t limited to the Washington, D.C. Metro Area. Federal IT demand, anchor agencies and opportunities for emerging 8(a) firms exist in regional markets throughout the country. Larger markets may have more firms active and more sales overall, but smaller regional markets can be a potential way for firms to build federal past performance.
For an IT company considering the SBA 8(a) program, the right market may depend on more than total federal spending alone. The number of active 8(a) IT firms, the agencies and buyers operating in the market, average sales, and the estimated Year-1 break-in base can all help identify markets worth evaluating.
The regional rankings are a useful starting point for seeing where federal IT demand is concentrated and which markets might have real opportunities for emerging 8(a) IT firms. Looking at these factors together helps businesses zero in on the right target markets and agencies as they build out their federal contracting strategy.
Ready to Explore Your 8(a) Eligibility?
If you have questions about this market data or want to determine if your firm meets the SBA’s 8(a) program qualifications, contact our strategy team today.
Call direct for a complimentary consultation: 859-442-3300